We love stats here at EcommerceGold and often use them in our posts BUT we found a big problem with a lot of ecommerce related stats online and that is that they are outdated and in some cases very outdated.
So much so, that some of these commonly quoted stats were published over 5 years ago, with a common one being:
- By 2040 95% of all sales will be done online (Nasdaq 2017)
So we have decided to make the most relevant list of ecommerce stats and our aim is that none of the stats quoted are more than 2 years old, we also link to all of the original sources.
Global Ecommerce Statistics
1) Global ecommerce sales are expected to hit $5.7 Trillion in 2022 and $7.5 Trillion by 2025
The global pandemic was the catalyst for a boom in ecommerce sales over 2020 ($4.2 Trillion) and 2021 ($5.2 Trillion) but it is believed that ecommerce sales will continue to grow over the next few before hitting estimated sales of $7.5 Trillion in 2025 (source: Insider Intelligence)
2) By 2025 Ecommerce Sales are expected to make up 23% of total retail sales
As ecommerce is expected to continue to grow over the next few years, so is their share of the total retail market, which shows a continued trend towards people buying goods and services online (source: Insider Intelligence)
3) China is the world’s largest ecommerce market with sales totalling $2.6 Trillion in 2021, with sales expected to hit $3.7 Trillion by 2025
The Chinese ecommerce market is by far the largest domestic by some distance, so much so that it is larger than the other 9 countries that make up the top 10 combined and this is expected to continue to grow, with estimates of sales totaling $3.7 trillion by 2025! (source: Insider Intelligence)
4) 50% of China’s retail sales are expected to be via ecommerce in 2025
China is the first major market where it is anticipated that over 50% (50.6% to be exact!) of the total retail sales are expected to be made online, which is significantly higher than any other major market (source: Insider Intelligence)
5) US Ecommerce sales are expected to exceed $1 Trillion in 2022 and reach $1.4 Trillion by 2025
The US is the second biggest market when is comes to online sales but it is expected that in 2022 they will reach a significant milestone of more than $1 trillion in 2022 and reach over $1.4 trillion in 2025. (source: Insider Intelligence)
6) US B2B Sales are estimated to hit $2.4 Billion by 2025
A lot of focus is placed on the overall ecommerce sales but b2b ecommerce is becoming more and more important as manufacturers, suppliers and wholesalers are beginning to see the opportunities offered by selling online and total sales are expected to hit $2.4 billion in 2025, up from $1.5 billion in 2021 (source: Insider Intelligence)
UK Ecommerce Statistics
7) The UK is the world’s 3rd biggest ecommerce market and the largest single market in Europe
For a little island, the UK certainly packs a punch when it comes to ecommerce and is the third biggest market in the world and while it is some way behind China and the US (which is understandable), the size of the UK’s ecommerce market is greater than Frances, Canadas and Spains combined! (source: Oberlo)
8) UK Ecommerce sales totaled £129 Billion in 2021, up from £112.7 Billion in 2020
UK ecommerce sales have increased a lot since the pandemic (£75.4 billion in 2019 to £129 billion in 2022) and are estimated to continue to grow but the pace of growth is expected to slow to around 4% a year through till 2026 (source: Statista and Insider Intelligence)
9) Internet sales accounted for 30.7% of all retail sales in 2021
Official figures from the Office of National Statistics show that over 30% of all retail sales in 2021 were made online and this figure is expected to continue growing, with the pandemic having a helping hand in boosting online sales. (source: ONS)
10) 84% of the UK’s internet users bought goods or services online in 2021
Not only does the UK buy a lot of stuff online for a small island but lots of people buy stuff online with 84% of internet users making a purchase online. While 84% is quite high, it is still some way off Denmark (92%) and the Netherlands (94%). (source: Ecommerce Europe)
11) 88.6% of UK Online Shoppers make a purchase at least once a month, with 34.9% making a purchase at least once a week
So not only do a lot of UK internet users buy online but they also do it on a regular basis with over 88% of people making a purchase at least once a month and over a third buying something once a week (source: Idealo)
12) Google was the UK’s most popular search engine in 2021 with a 92% market share
Google continues to dominate search in the UK with a 92% market share, with their closest rivals being Bing with 3% and Yahoo with 2%. (source: Ecommerce Europe)
13) 66% of web traffic came from Mobile Devices
The UK is a very mobile-forward country, especially as 88% of the population over the age of 16 own a smartphone and it is understandable that 66.27% of all website traffic came from mobile devices, compared to just 33.73% from desktops. (source: Similarweb)
Mobile Ecommerce (Mcommerce Stats)
14) Traffic from mobile devices averaged 55% in 2021, up from 43.66% in 2016
Mobile devices are continuing to be the main device type that people are using to browse online and this is naturally meaning that ecommerce stores are now also seeing more traffic from mobile devices and it is estimated that this will continue to increase (source: Statcounter)
15) US Mobile ecommerce sales were over $359 Billion in 2021 and estimated to grow to $728 Billion by 2025
The growth in mobile traffic is directly correlating in growth in US sales made using mobile devices, with sales totaling $359 billion in 2021, which is an increase of 15.2% over 2020 and this is a trend that is estimated to continue over the next few years, with sales estimated to be $728 billion by 2025. (source: Insider Intelligence)
16) 71% of all purchases on Black Friday 2021 were made on Mobile Devices
Data collected from Shopify merchants on Black Friday in 2021, showed that 71% of purchases were made using mobile devices, up from 67% in 2020. (source: Shopify)
17) In 2021, Mobile accounted for 56% of online sales
Throughout 2021, mobile was king and accounted for 56% of all online sales compared to 44% from desktop (source: SaleCycle)
18) 88% of consumers are more likely to make a purchase on mobile devices if the site or app has product reviews
Being mobile-friendly and even mobile first is always enough to get and user-generated product reviews were shown to have a very positive impact on sales, with 88% of customers saying that they would be more likely to make a purchase if the app or mobile site had product reviews. (source: Power Reviews)
19) A load time of 2.6 seconds or less puts your site in the top 10% for performance
A survey of over 6,000 websites found that the average full page load time was 4.5 seconds and a load time of less than 2.6 seconds puts you in the top 10%. (source: Little Data)

Ecommerce Conversion Rate Statistics
20) Position 1 in Organic Search results had a click-through rate of 33.3% in 2021
An important part of getting sales is getting people to your site and in 2021, the top spot in organic search results saw an average click-through rate of 33.3%, this dropped to 15.86% for position 2 and 9.42% for position 3. (source: Advanced Web Rankings)
21) Organic Search has an average conversion rate of 3.3% for B2C Ecommerce sites
Organic search has the highest conversion rate for ecommerce websites, with an average of 3.3%, which beats email marketing (2.2%), paid search (1.2%) and social media (1.1%), meaning that SEO overall has the best conversion rate for ecommerce businesses. (source: Ruler Analytics)
22) B2B Ecommerce sites have an average conversion rate of 4% from organic search
B2B ecommerce stores have an even better conversion rate from organic search than b2c sites at an average of 4%, which is considerably better than the 1.8% average for paid search and 2% from social media. (source: Ruler Analytics)
23) Product review interaction saw an increase in conversion rate of 120.3%
A rather incredible statistic is that when site visitors interact with reviews on the product page that the conversion rate increased by just over 120%. (source: Power Reviews)
24) The average conversion rate for Shopify stores is 1.4%
This might make painful reading for some Shopify store owners but the average conversion rate is 1.4% and stores with a conversion rate of 4.7% or greater are in the top 10%. (source: Little Data)
25) The average conversion rate for WooCommerce stores is 0.3%
It is even worse for WooCommerce store owners as the average conversion rate is 0.3%, which is very low but stores with a conversion rate of 3.3% or higher are in the top 10% (source: Little Data)
26) The average Abandoned Cart rate was 80.68% in 2021
In 2021, the average abandoned cart rate was just over 80%, which was actually down on 2020s 81.08% average. (source: SaleCycle)
27) Mobile devices had an average abandoned cart rate of 71.72% compared to 28.28% on desktop
While traffic from mobile devices is now number 1, it is also causing problems with abandoned carts as a visitor on a mobile device is more than twice as likely to abandon their cart. (source: SaleCycle)
28) A 1-Second Improvement in Load Speed Can Lead to a 17% Increase in Conversion Rates
The faster your site loads, the more likely it is that people will buy from you and a study found that a 1 second improvement in load time can lead to a 17% increase in conversion rates (source: Bidnamic)
Ecommerce Social Commerce Stats
28) Sales through Social Media platforms hit $492 Billion in 2021 and are estimated to reach $1.2 Trillion by 2025
Social commerce is definitely on the rise and social media is now more than just advertising as sales through social media platforms hit $492 billion in 2021 and is estimated to reach $1.2 trillion by 2025. (source: Insider Intelligence)
29) Gen Z and Millenials are predicted to account for 62% of global social sales by 2025
In a rather unsurprising statistic, it is predicted that the younger Gen Z and Millenial generations will account for 62% of social sales. (source: Accenture)
30) 59% of consumers made a purchase directly from social media
Over half of consumers have made a purchase directly through a social media platform, showing that selling directly through social media can be incredibly effective (source: Square)
31) 59% of social media buyers are more likely to support small-medium sized businesses
Over half of social media buyers are prepared to buy from small-medium-sized businesses than they would through traditional ecommerce sites. (source: Accenture)
32) 44% of social media buyers are more likely to buy from a brand that they hadn’t previously encountered
Just under half of social media buyers are more likely to buy from brands that haven’t previously encountered, meaning that social selling can open ecommerce businesses up to audiences that they may not have been able to reach otherwise (source: Accenture)
33) 63% of social media buyers are more likely to buy from the same seller again
Repeat business is incredibly important in ecommerce and an appealing statistic is that 63% of social media buyers are likely to buy from the same seller again. (source: Accenture)
34) 69% of consumers have been inspired to make a purchase by seeing it on social media
Social media can be a powerful marketing tool for ecommerce sites as is evidenced by the stat that 69% of consumers have been inspired to buy something just from seeing it on a social media platform. (source: Bazaar Voice)
35) 43% of buyers prefer digital wallets or mobile payments when buying through social platforms
Buying through social media is all about convenience and the transaction being as easily as possible, which is why 43% of buyers prefer to use digital wallets or mobile payment options when making a purchase through social media platforms. (source: Essence)
Ecommerce Consumer Behaviour Statistics
36) 58% of shoppers say an excellent customer experience in the past is a driving factor for making a future purchase
Customer experience is hugely important when it comes to ecommerce and there are many factors that fall under this heading but as 58% of shoppers say that a previous experience with the store was excellent is the driving factor for becoming a repeat customer, it shows how important this is for ecommerce businesses. (source: Shopify)
37) 43% of consumers say that they are likely to use live chat when contacting an ecommerce business
While there are many contact options that a business can offer, live chat is becoming a more popular option and 43% of consumers are likely to use this when contacting an ecommerce business. (source: Shopify)
38) 37% of monthly retail purchases are made online
Over one-third of monthly purchases are made online, meaning that ecommerce is becoming a more popular option for consumers every year. (source: Square)
39) 30% of global consumers shop online at least once a week
3 in 10 people around the world purchase goods or services online at least once a week. (source Bazaar Voice)
40) 38% of consumers purchase from online marketplaces at least once a month
Marketplaces such as Ebay and Etsy are often overlooked sales channels for ecommerce businesses but as 38% of consumers purchase from an online marketplace at least once a month, they are a potential viable sales channel. (source: Shopify)
UGC and Reviews Statistics
41) In 2021, 99.9% of online shoppers read online reviews at least sometimes with 61% of online shoppers saying they always read reviews
Reviews are a hugely important aspect for ecommerce businesses and with nearly 100% of online shoppers saying they read online reviews at least sometimes, it shows how important they are and this is up from 97% in 2018. (source: Power Reviews)
42) 98% of customers say that reviews are an essential resource when making a purchase
This shows how important reviews can be in ecommerce as 98% (up from 89% in 2018) of consumers view reviews as an essential resource and 86% of shoppers won’t make a purchase until they have read reviews. (source: Power Reviews)
43) 80% of consumers saying the more expensive the item, the more important the reviews
Reviews are more important for all items but 80% of consumers said that they are even more important on expensive items, with 95% electronics being the category where reviews are seen as the most important. (source: Power Reviews)
44) 93% of consumers read reviews on retail websites
The source of the reviews is also an important factor and 93% of consumers read reviews directly on retail websites, compared to 63% on brand websites, 65% on search engines and 42% on independent review sites. (source: Power Reviews)
45) 96% of consumers will actively seek out negative reviews
Nearly all consumers will actively seek out negative reviews, with 52% just looking at 1-star reviews. (source: Power Reviews)
46) An average star rating of between 4.2 and 4.5 was most likely to lead to a sale
But negative reviews aren’t actually a bad thing and an average rating of between 4.2 and 4.5 is most likely to lead to a sale and 46% of shoppers are weary of a perfect 5-star review. (source: Power Reviews)
47) 53% of shoppers said that UGC such as social images made them more confident in making a purchase
Over half of shoppers said that seeing user-generated content such as social images made them more confident in purchasing a product than professional product images. (source: Bazaar Voice)
48) 40% of consumers say that seeing UGC on ads, such as reviews and photos makes them more likely to purchase
And seeing user-generated content on company ads in the form of reviews and photos made them more likely to purchase that product, so incorporating UGC content into ads could be beneficial for ecommerce businesses (source: Bazaar Voice)
49) Customers are 76.7% More Likely to Make A Purchase When a Page Has Reviews
Reviews can have a big impact on conversion rates and pages with up to 100 reviews see a 76.7% increase in conversion rates than pages with 0 reviews (source: Power Reviews)
Ecommerce Platforms & Payment Methods
49) Shopify is the world’s most popular ecommerce platform with a 27% market share
Shopify has become the world’s most popular ecommerce platform, with a 27% market share across sites of all sizes and is estimated to power 3.8 million stores, WooCommerce is second with 25% and Wix stores is third with 13%. (source: BuiltWith)
50) Of the top 1 Million Ecommerce Sites, WooCommerce is the most popular with a 26% market share
It changes slightly when we look at just the top 1 million sites as WooCommerce is the most popular with a 26% market share, followed by Shopify with 20% and Magento with 8%. (source: Builtwith)
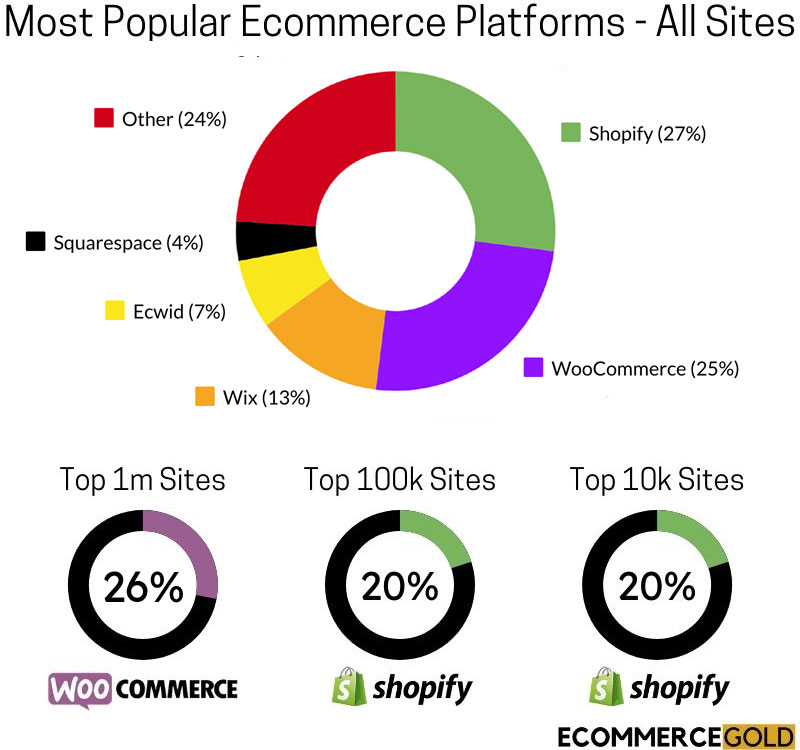
51) Shopify has 20% market share with the top 100k and 10k Ecommerce Sites
Shopify dominates with the top ecommerce sites in the world with a 20% market share in both the top 100k and top 10k ecommerce websites. For the top 100k, WooCommerce sits second with 14% market share and of the top 10k sites worldwide, Magento sits second with 8% market share. (source: Builtwith)
52) Digital/Mobile wallets are the most popular payment method, with a 49% market share
Not surprisingly, due to their ease of use and also convenience, digital/mobile wallets are the most popular payment method with a 49% market share, followed by credit cards with 21% and debit cards 13% market share respectively (source: Statista)
53) PayPal is the most popular payment gateway with a market share of 50.32%
In 2021, PayPal was the most popular online payment gateway with a market share of just over 50%, followed by Stripe with 15.38% and Shopify Pay with 9.26%. (source: Statista)
54) WordPress powers 43% of the world’s websites
The WordPress CMS is the world’s most popular website builder and is estimated to power 43% of the world’s websites, which gives it a considerably larger market share than Shopify (4.1% of all sites) and Wix (2.3% of all sites), which are its closest competition. (source: w3techs)
Conclusion
So there it is, our list of the latest and greatest ecommerce stats!
I hope this compilation has been helpful as it took many hours of searching for and then reading through reports to pull out all of the relevant stats that may be of use to you or just may be of interest.
P.S If you are a company that produces annual reports with interesting stats and would like to be featured, then please feel free to contact us.

Hi, I'm Paul, the Owner and Founder of EcommerceGold.
I ran my own Ecommerce Business for over 7 years and now help others start their own online retail empires!